📈 Support & Resistance
Support and Resistance are foundational concepts in technical analysis. They help traders understand where price may pause, reverse, or break through based on past price behavior.
🔽 What is Support?
Support is a price level where a falling asset tends to find buying interest strong enough to halt or reverse a downtrend. It is often identified by multiple touches without breaking below.
🔼 What is Resistance?
Resistance is a price level where an uptrend is expected to pause due to a concentration of selling. It often marks areas where traders previously sold off an asset.
🔁 Support Becomes Resistance (and Vice Versa)
When price breaks below a support level, that same level may turn into resistance on the way back up — and vice versa. These are called “flip zones.”
🚫 False Breakouts
A false breakout occurs when price appears to break support or resistance but quickly reverses. Watching for volume confirmation or retests can help avoid getting trapped.
-
Example 1: Price bounces multiple times from support (2-3 touches) — forms a support zone.
-
Example 2: Price rallies, builds support, then breaks to the upside — resistance breakout.

-
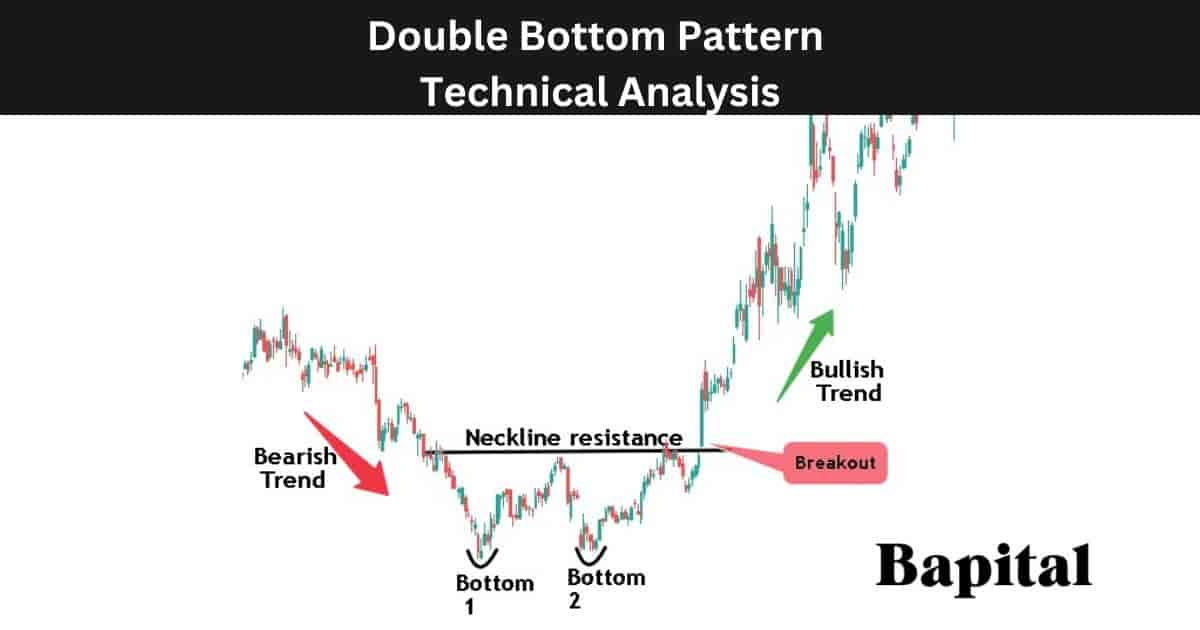
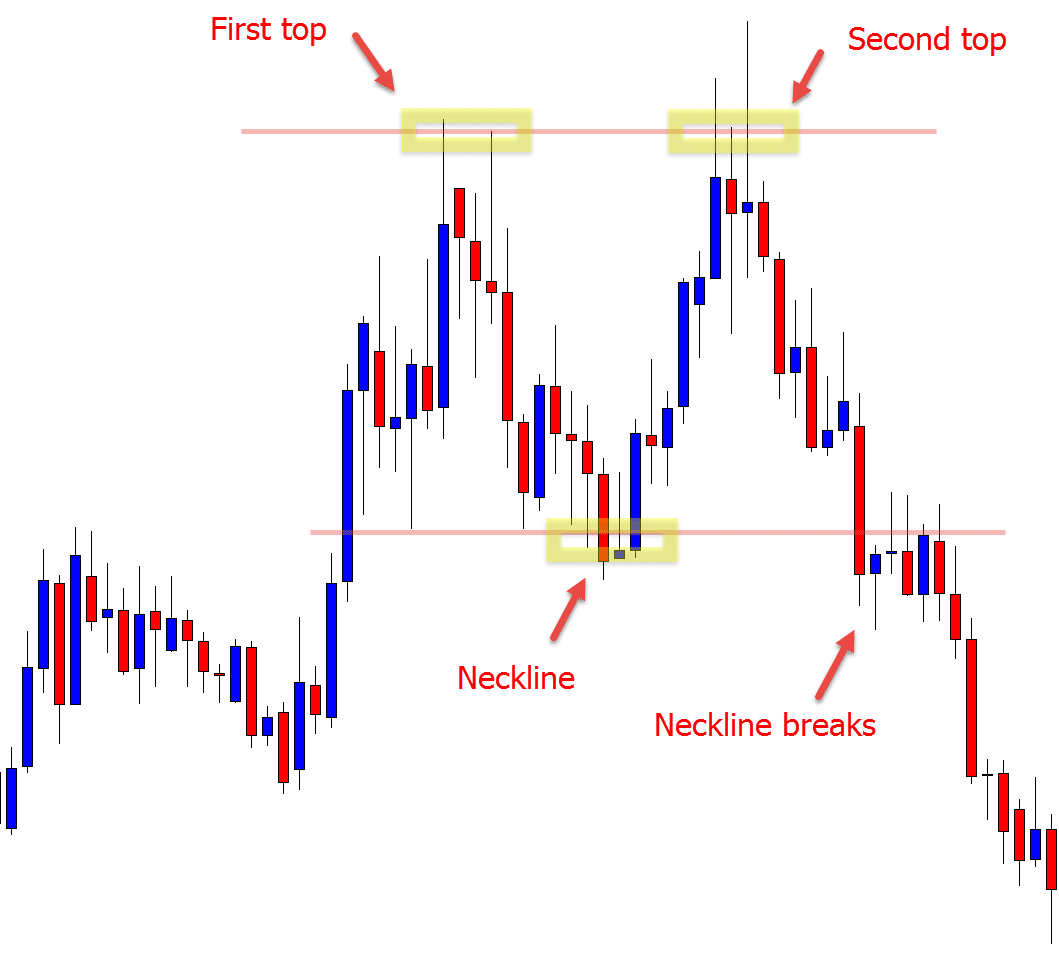
Example 3: Breakout to the downside — former support becomes new resistance ("double top").
📊 Volume Confirmation
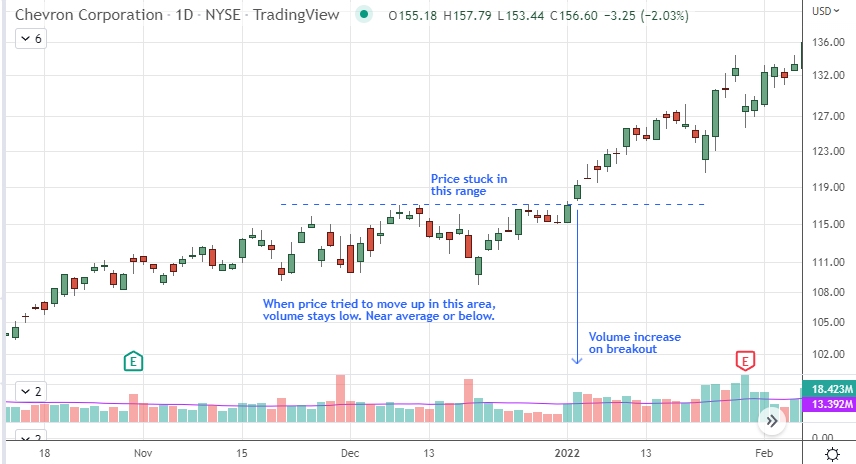
Volume tells us the strength behind a price move. Higher volume confirms breakouts or breakdowns.
-
Example 1: Price breaks resistance with high volume — valid breakout
-
Example 2: Price spikes down but volume is weak — possible fakeout

-
Example 3: Volume builds up before breakout — accumulation phase
🕯️ Candlestick Patterns
These patterns help predict short-term direction in the market.
-
Hammer: Bullish reversal after a downtrend
-
Bearish Engulfing: Signals potential trend reversal downward
-
Doji: Indicates indecision — watch next candle for confirmation